PRTG Network Monitor
Comprehensive Network Monitoring
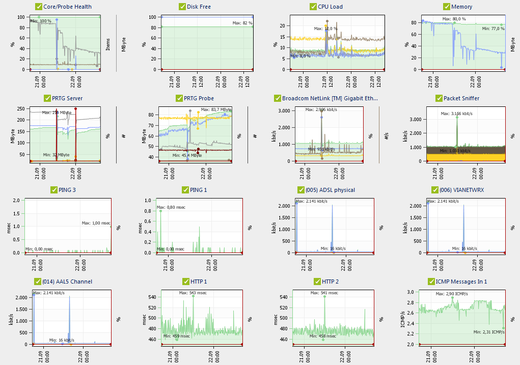
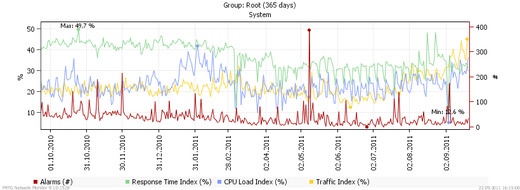
Aggregated statistics (availability, bandwidth/traffic, CPU-load, alerting) provide the quickest possible overview of the current status of a complete network. These stats are available for all sensors, as well as “per group,” enabling the administrator to dig into the data from a birds-eye view of the network, down to each individual device.
Bandwidth Monitoring using Packet Sniffing/NetFlow/jFlow/sFlow
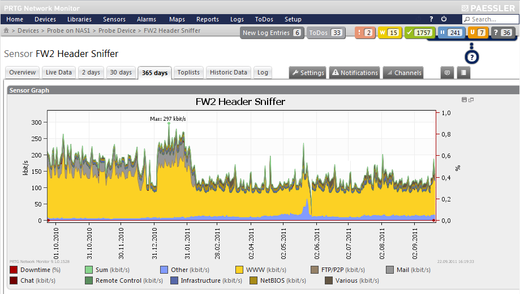
If you need to know what applications or IP addresses are causing troubles in your network you can use packet sniffing (PRTG looks at every single data packet travelling through your network for accounting purposes) or NetFlow/jFlow/sFlow-based monitoring. For both technologies PRTG can analyze the bandwidth usage and break it down to the network protocols or computers in your network.
Video : PRTG – Bandwidth Monitoring with SNMP and WMI
Alerting
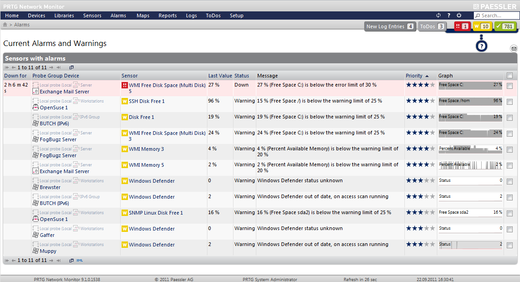
Regardless of whether or not you are a large corporation, you need to be notified in real-time when problems arise. PRTG alerting system will simplify the distribution of alerts, reduce the time it takes to resolve alert and allows you to gain visibility into alert workflow.
- Alarms (red) are sensors that are either unavailable (e.g. due to a software crash or hardware failure) or that exceed a configurable value range (e.g. free disk space below 10%).
- Warnings (yellow) are triggered by services that are working slow (e.g. slow website) or by systems that are getting close to resource exhaustion (e.g. low memory or high cpu load).
- PRTG marks sensors with an “unusual” state (orange) if their current readings show unusual behavior when compared to readings in the past (computed through statistical analysis).
Video : Setting up notifications in PRTG
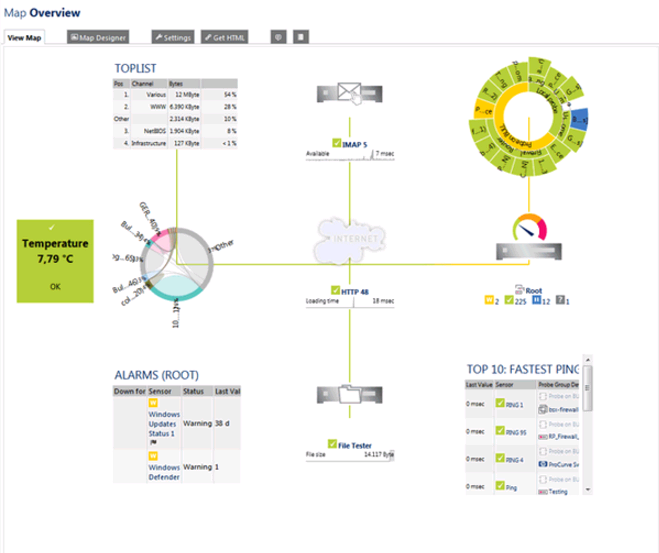
PRTG Maps
With PRTG Maps, you can easily create your custom dashboards as you see fit by using the built-in Maps editor. PRTG interactive map designer provide more than 300 different map objects , such as network icons, top 10 lists, charts, status icons and more.
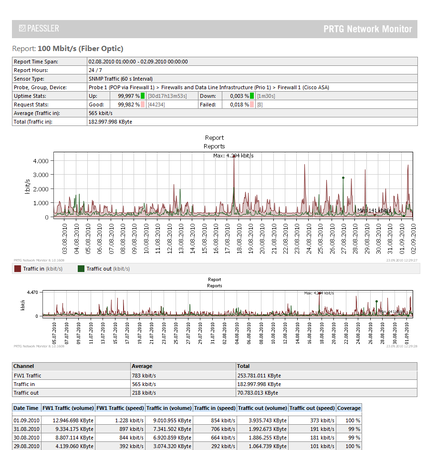
Comprehensive Reporting
Reports are used to analyze historic monitoring results over a specified time such as one day, one month or one year. PRTG includes a powerful reporting engine for ad-hoc, as well as scheduled report generation in PDF format. Reports can be run on-demand or can be scheduled (e.g. once a day). A report can be created for one or more sensors. The content and layout of the report is controlled by the report template of your choice. Learn more about PRTG comprehensive reporting
PRTG is suitable for networks of any size
PRTG Network Monitor has been designed to work for networks of any size. It can be implemented in small networks with just a few devices (e.g. the Freeware edition is capable of monitoring 100 sensors for free) or you can integrate it in large networks using an unlimited numbers of sensors.